

DENVER — 9NEWS’ team of meteorologists shows the Colorado snowpack map quite often through the winter and spring.
Knowing where snowpack is at is important, because that’s where 50 to 80 percent of the Front Range’s water supply comes from. That’s important because it’s the water we use for drinking and irrigation.
When you look at the map, the numbers are compared to “normal.” That can be a little confusing. The word references the “median” snowpack from the last few years.
RELATED: You can't blame the 'unprecedented' Nebraska floods entirely on the bomb cyclone. Here's why.
Remember mean, median and mode from school? To get the median, you take a list of numbers from low to high, then the middle number is the median.

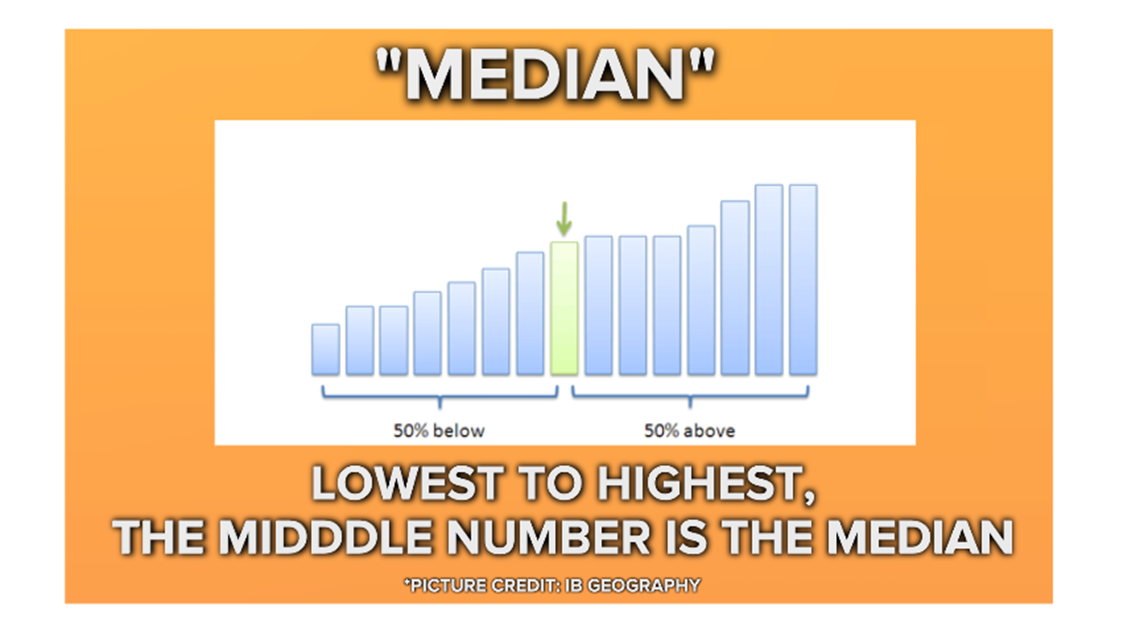
In the case for snowpack, it’s based on that day’s numbers. The Natural Resource Conservation Service has records for every single day at each site on where the snowpack was on that particular date. Those numbers are organized from lowest to highest, then the middle number is what’s compared to today’s number.
Then there are a few more steps to take the number from an individual site and include it in the median for a particular basin.
It’s a complicated process, but the important takeaway from the map is that above normal is a good thing. Ideally, we can save that water in our reservoirs (runoff depending, but that’s a whole other story) and it’s like extra money in the bank for a rainy day. Or in this case, a not-so-rainy day.
SUGGESTED VIDEOS | Local stories from 9NEWS