
DENVER — As the so far busy year continues for fire crews on the ground in Colorado, eyes are on the ever-changing wildfire risk along the Front Range from out of state.
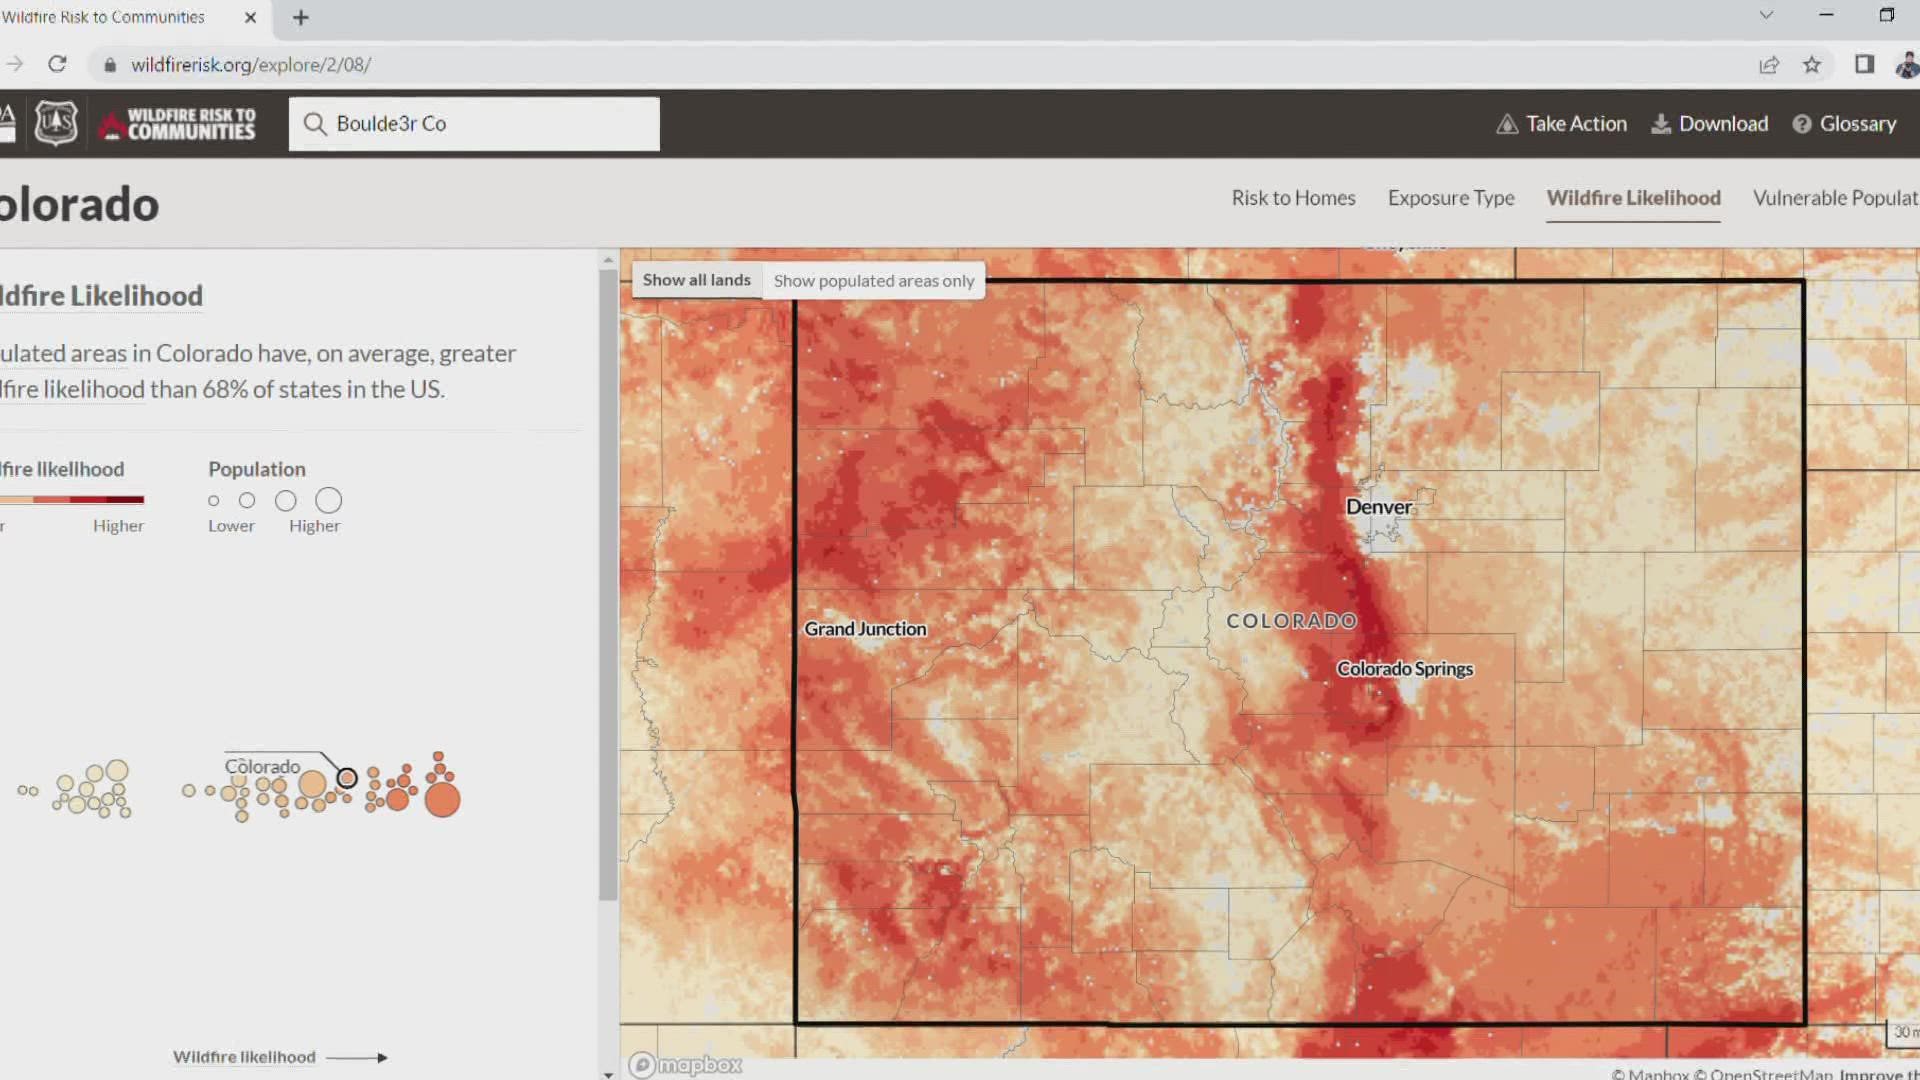
At the U.S. Forest Service's Missoula Fire Sciences Lab in Montana, a team put together an interactive map, as directed by Congress, to help show the wildfire risk to communities across the United States.
"We have a collection of research scientists doing science on a whole range of issues around wildland fire, everything from studying fire behavior to studying smoke and the chemistry of smoke to studying fire ecology and how fire operates on the landscape and in ecosystems," said Greg Dillon, Director of the Fire Modeling Institute at the lab.
One of the goals of the website is to help guide community leaders, planners and fire managers as they decide how to handle the treatment of the fuels of destructive wildfires.
It's the first time the entire country has been mapped for wildfire risk to communities, according to the website.
It also contains resources and guidance for wildfire preparedness and mitigation for homeowners.
As for the interactive map, under the portion that shows the average wildfire risk to homes (the dark red shows where it's higher risk), much of the Front Range is highlighted as a higher risk.

A few things stick out to Dillon when it comes to Colorado's Front Range.
"You get different gradients of vegetation with the mountains. And so that affects the property of the fuels and the likelihood of a fire occurring in different places," he explained. "And the other interesting thing is, you know, as those fuels or the vegetation transitions from the mountains out into the foothills and the plains, you still can have the fire risk extending out quite a ways."
His team uses fire occurrence records and weather pattern records to help form and update the map.
Dillon noted that when they first started this work, the Front Range didn't have as many records of large fire, when looking back a few decades as compared to other places across the western part of the country.
"And we knew that there was still the potential there. And so we've kind of had our eye on that as we've been doing the mapping successfully over the last several years," he said. "And as anyone that lives in the Front Range knows, you know, you all have seen an increasing number of large fires in recent years. And so now we're starting to have those records of large fires in our database so that when we calibrate our models to what we've seen in the past, our outputs are now reflecting a higher degree of risk and a lot of the Front Range."
He also explained the patterns his team has observed on the Front Range.
"I think the general pattern that we see across a lot of the forest, like what you all have in the Front Range is, we have conditions with fuels where we have forests that maybe historically had lower density of trees, had more frequent fires where those fires would have removed the fuels on the surface. And when we don't have regular low intensity fire, those fuels build up. And so that's leading to some of the large fires that we're seeing in the Front Range. And that's a situation that's been building for a lot longer than the last few years," he explained.
After the Marshall Fire for example, his team checked the maps related to wildfire risk.
"To see like, 'okay, that was in a place where a lot of people really didn't expect to see wildfire.' And yet when we looked at our maps, actually, if you look at those areas, a lot of them did map as moderate to high risk because there are still some some natural vegetation in that area. And then, of course, you get the factors of high winds and fire weather that's conducive to fire spread and you can get fire occurring even in places that might be mapped as moderate to low risk," said Dillon.
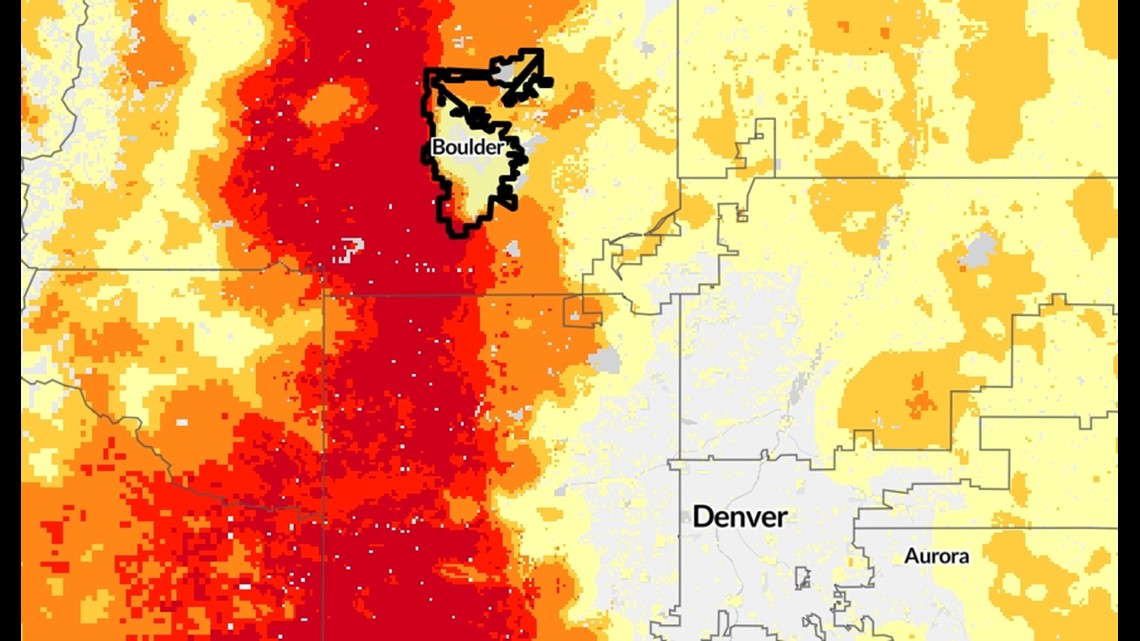
For instance, according to the map, populated areas in Louisville have, on average, greater wildfire risk to homes than 30% of communities in Colorado, compared to 65% in Boulder.
Overall, he says the message behind the work is meant to help communities.
"A lot of the message needs to be around the fact that people have to take a certain amount of responsibility for doing work around their own properties to make their homes less ignitable, so that when that wildfire that, maybe inevitable happens, their home may not be as at risk because they've taken action to prevent it from igniting," he said.
SUGGESTED VIDEOS: Wildfires in Colorado