

COLORADO, USA — The snow that falls in the Colorado Rockies ends up in your water bottle, growing your crops or reducing wildfire danger. About 80% of Colorado's fresh water comes from melted snow. It’s a very important thing to track, so you will see this Snowpack Map broadcast by 9NEWS frequently. But what exactly is snowpack?

The numbers
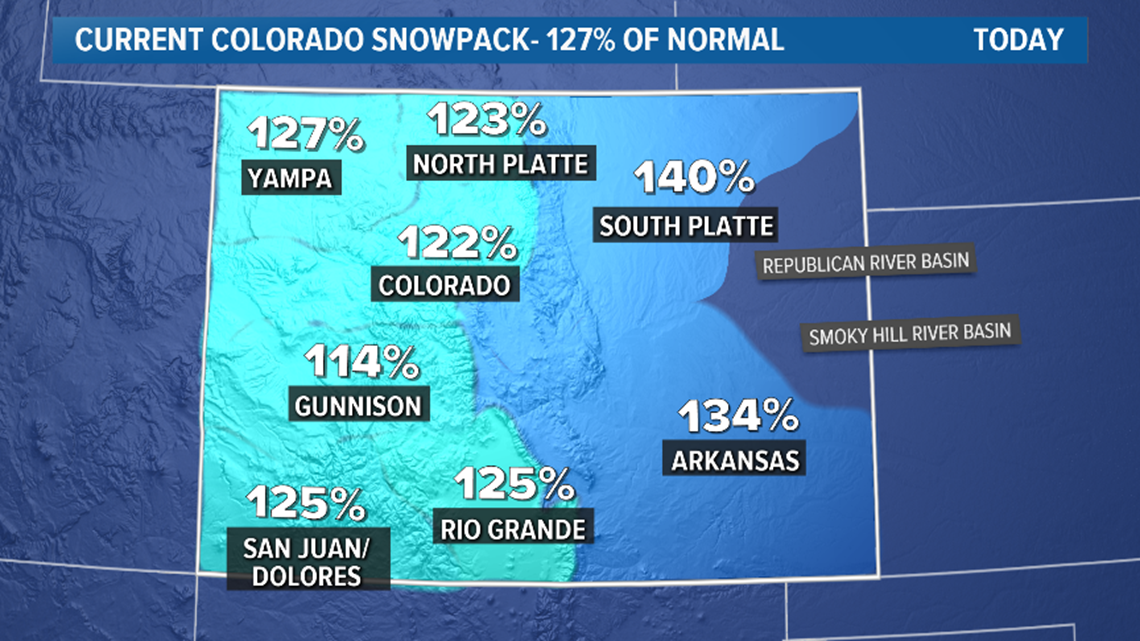
These percentages on the map show how much snowpack there is in our mountains compared to what is normally there on a given day. Snowpack is simply the snow that accumulates on the ground from October to June.
Many of these stations will often get more than 10 feet of snow before it starts melting in April, but snowpack is measured in terms of SWE which is Snow to Water Equivalent. That is how much water you would get if you melted all the snow.
There is also a statewide average. Keep in mind that 100% is average, so on Wednesday, our state was 27% above average.
SNOTELS
Snowpack measurements are taken by special weather stations called SNOTELS or Snow Telemetry Sites. There are 115 of them in Colorado from about 8,000 feet to nearly 12,000 feet elevation, and they’re run by the Natural Resources Conservation Service (NRCS).
River Basins
On the map, you see eight shaded regions representing 12 river basins. The eight zones are hard to make out when they are all at similar snowpack levels.

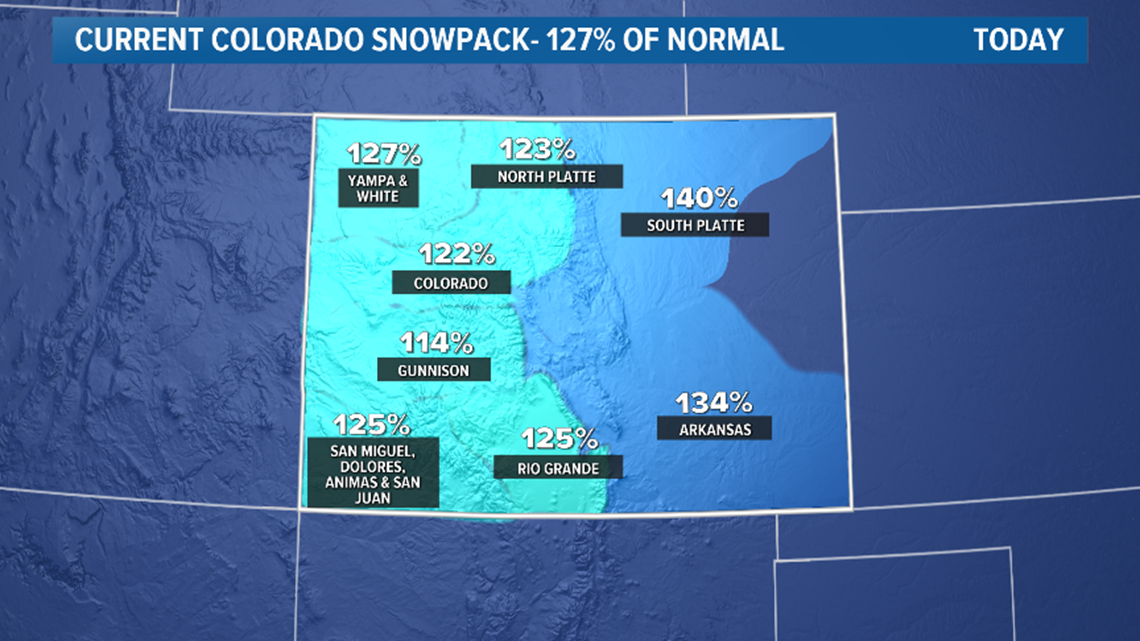
The entire area that benefits from the snowmelt is shaded. The blank area in eastern Colorado is a spot that does not receive runoff from the Colorado mountains. It’s actually its own headwaters to the Republican and Smoky Hill River basins.
What is average?
You will here snowpack reported as an average, but it is actually a median. That is when all the years are stacked in order from high to low, and the middle number is selected as the median, instead of adding all the data together and dividing by the number of years. There is rarely much of a difference between average and median snowpack, but there is a subtle difference.
Both the median and the average are calculated from what's called the Period of Record. That is a time frame of 30 years used by scientists in climate studies. The current Period of Record is from 1981-2010.
In January of 2021, the Period of Record will switch to 1991-2020.
Also note that each day a new average is calculated, so the current snowpack levels are not being compared to a yearly average, but a daily one.
SUGGESTED VIDEOS | Science is cool